
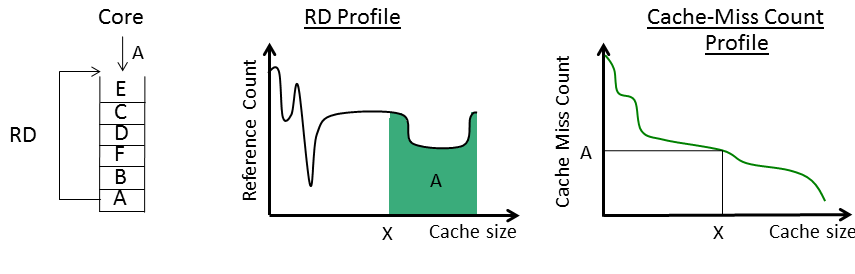
We are developing a new methodology for evaluating multicore cache hierarchies that is much faster than simulation and provides greater insights into parallel memory behavior. Our techniques are based on reuse distance (RD) analysis which captures the program-level locality that affects cache performance. Currently, our work focuses on programs with homogeneous threads in which the parallel threads all perform similar computations. (For example, programs exploiting loop-level parallelism exhibit this property). More specifically, our techniques provide two major types of information: the locality within individual threads--i.e., intra-thread locality--and the interactions between threads that can affect per-thread locality. The former is based on uniprocessor RD analysis. In particular, to profile the locality of a single thread, we play the thread's memory reference stream on a single LRU stack, as shown below. For each memory reference, we search the stack for the corresponding memory block, and note the stack depth or reuse distance for that block. (After the reference, the block is moved to the top of the stack to maintain LRU ordering). The histogram of all such reuse distance values across the entire program is the program's RD profile. This profile can be used to predict the number of misses incurred by the program on a cache of size X by simply computing the area under the profile to the right of X. The key benefit of RD profiles is that they are architecture independent, so a single profile can be used to predict cache misses at any cache capacity without having to run numerous simulations (just perform the area integral for all X).
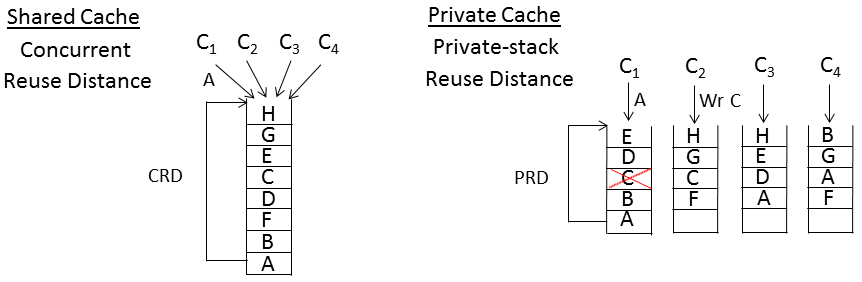
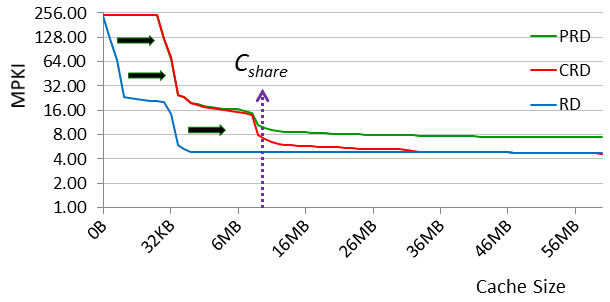
In the above figure, the RD profile shows FFT's locality on a single thread--i.e., its intra-thread locality. So by comparing the CRD and PRD profiles against the RD profile, we can see the impact of thread interactions. The example illustrates this impact varies across cache capacity, corresponding to changing reuse patterns at different depths of the CRD and PRD stacks. In particular, small cache capacities reflect the reuse near the top of the stacks. Here, memory blocks are heavily reused, exhibiting high temporal locality. More importantly, these memory blocks also tend to be private to individual cores. (Programmers avoid sharing heavily accessed data for performance reasons). So, the only thread interaction is capacity pressure; there is no data sharing. Furthermore, under the assumption of homogeneous threads, each thread brings in roughly the same amount of data into the stacks. Hence, the capacity pressure is linear in the number of threads. As the above figure shows, at small cache sizes, the CRD and PRD profiles shift linearly to higher capacities relative to the RD profile. Notice, the CRD and PRD profiles are also coincident in this small-cache region. In the absence of sharing, CRD and PRD stacks behave identically. This means that in the small-cache region, there is no difference in miss rate between a shared and private cache of the same total size.
In contrast, large cache capacities reflect the reuse near the bottom of the stacks. Here, memory blocks are infrequently reused, exhibiting low temporal locality. And, there tends to be data sharing (though the amount is application dependent). Due to data sharing, at large cache sizes, the CRD profile's shift relative to the RD profile slows down, and the CRD profile moves towards the RD profile. Because shared memory blocks are not replicated in the CRD stack, data sharing tends to reduce capacity pressure for shared caches, thus the lessening shift in the CRD profile. (The CRD and RD profiles actually become coincident beyond some capacity--in other words, the shared cache exhibits the same miss rate as the uniprocessor cache. We omit the detailed discussion of this phenomenon, and refer the interested reader to our ISCA 2013 paper for more details.) However, the PRD profile's shift does not stop in this large-cache region. Unlike the CRD stack, data sharing in PRD stacks causes replication (for read sharing) and invalidations (for write sharing). As a result, the PRD profile keeps shifting, and a gap opens up between the two profiles. This PRD-CRD gap represents the advantage in miss rate that a shared cache holds over a private cache of the same total size due to data sharing. Notice, the gap exists only beyond some critical capacity, which we call Cshare. Cshare is the minimum size of cache needed to start seeing sharing effects occur within the cache hierarchy, and hence differentiation between private verus shared caches in terms of miss rate.
The above insights not only explain the impact of thread interactions on program locality, they also dictate what happens across the multicore cache hierarchy design space as different design parameters are varied. First, changing core count shifts the CRD and PRD profiles back and forth relative to the RD profile. The shift is non-uniform (it is linear at small cache sizes and sub-linear at large cache sizes), but the fundamental impact is profile shift. Second, if designers keep core count fixed but vary cache capacity, then the profiles freeze and we instead move along the X (capacity) axis of the profiles. As caches are scaled up, miss rate of course goes down. But a more subtle point is that we also modulate sharing. We start with little to no sharing at small cache sizes, but then once capacity increases beyond Cshare, we start noticing sharing and differentiation between shared and private caches. Finally, designers may vary the cache organization between private and shared. (Although not discussed above, multicore processors may also employ cluster caches in which groups of cores share a cache. In general, we can define a cluster size that tunes the degree of clustering from fully private to fully shared. The locality profiles of intermediate cluster sizes would lie in between the PRD and CRD profiles shown above.) This action moves between the gap defined by the PRD and CRD profiles, but only has an effect at capacities beyond Cshare.
Although these insights have been explained for a single benchmark only, FFT, we find they are valid for all parallel programs exploiting loop-level parallelism. (See our ISCA 2013 paper for the full results).
In our study, we show that our techniques are quite accurate, achieving an absolute error of 15%. More importantly, our techniques also have very good relative accuracy. We are able to identify the best simulated configuration in most cases, or a configuration that is within 5% of the best. Thus, multicore RD analysis is a very effective tool for rapidly zeroing in on the "most interesting" cache hierarchy configurations in the design space. Besides identifying the best cache hierarchy configurations, multicore RD analysis can also explain why certain configurations are optimal through the CRD and PRD profiles. To illustrate, the figures below show the CRD and PRD profiles for two benchmarks from our study: Water from the SPLASH2 suite and Canneal from the PARSEC suite. (In addition to plotting PRD in green and CRD in red as was done above, we also plot in black the profiles for cluster caches with different cluster sizes). We have also indicated on the profiles the optimal capacity for the L1 cache using a circle and the optimal capacity and cluster size for the L2 cache using a diamond.
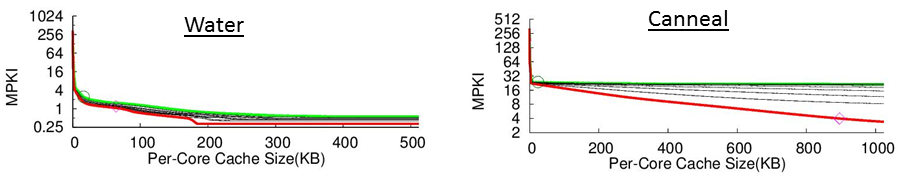
As the figures above show, the optimal cache size often occurs right after a large drop in the profiles. For instance, the optimal L1 cache size for both Water and Canneal exhibit this behavior. This makes sense: increasing the cache size to capture a large improvement in miss rate will almost always be worth it. However, going significantly beyond the drop may not be worthwhile if the incremental benefit does not justify the increase in capacity (and hence, power consumption). This insight also explains the optimal L2 cache size for Water. Although the maximum L2 capacity we allowed is 1MB per core, Water's profiles show there is a much smaller benefit in scaling the L2 cache. Instead, it is better to scale down the L2 to save power. Interestingly, the opposite happens for Canneal: the optimal L2 size is almost the allowed maximum. Although Canneal's PRD profile shows there is no benefit in scaling up a private L2 cache, Canneal exhibits significant data sharing with capacity scaling. So, the PRD-CRD gap grows with capacity, justifying a large shared L2 cache.
Evaluating Configurations that Can't be Simulated. As discussed above, core count scaling shifts CRD and PRD profiles relative to RD profiles. We note that this profile shift is systematic. In particular, the CRD and PRD profiles maintain their general shape throughout the shift--it's basically the shape of the RD profile. (This is due in part to the homogeneous threads assumption that we make in our work). Consequently, the shift is predictable: by comparing two profiles representing different core counts, we can measure the shift rate, and then construct profiles for other (possibly much larger) core counts via extrapolation. In our work, we have developed techniques to perform such profile prediction. (See our PACT 2011 paper for details). Besides core count scaling, we noticed a similar shape-preserving and systematic shift occurs across problem size scaling as well. In other words, the profiles for programs running large problem sizes can be predicted via extrapolation from profiles for the same programs running small problem sizes. This raises the possibility of using multicore RD analysis to evaluate the memory behavior of configurations--either along the core count or problem size dimensions--which are too large to simulate.
To demonstrate, we conducted a study on cache capacity scaling. We used our locality profiles to analyze the amount by which cache capacity should be scaled in order to maintain a constant cache miss rate as core count is scaled. In particular, we computed the constant miss-rate scaling factor for scaling core count from 1 to 256 cores. In essence, this is the amount of shift between the uniprocessor RD profile and the 256-core locality profile. Because the shift rate itself varies across cache capacity, we computed the scaling factor for all possible cache capacities. The left figure below shows the analysis for 16 SPLASH2 and PARSEC benchmaks. In these results, we profiled each benchmark running the largest problem size that comes bundled with the benchmark. Although these were the largest problems available to us, they were in fact very small problems. In every case, the running time would be less than 1 second on a physical CPU (on 1 core). In the graph, we also plot as a bold red line the scaling factor at each cache capacity for a total of 256 MB. While this is quite a bit of cache, we assume it is the upper limit for what could feasibly fit on a single chip in the future. Notice, the scaling factor for every benchmark and at every cache capacity lies below the bold red line. This suggests that all of the benchmarks are "scalable."
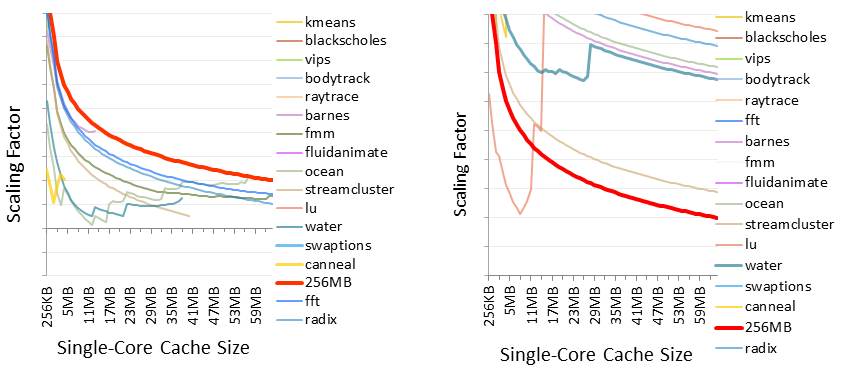
Next, we performed the exact same analysis, but for much larger problems. In particular, we scaled each benchmark's problem size so that it would take 1 week to run on a physical CPU using 1 core (about 40 minutes for 256 cores, assuming linear speedup). Unfortunately, it is impossible to acquire the locality profiles for these runs because they are too large for our profiler (or any existing simulator, for that matter). Instead, we predicted the corresponding locality profiles using the profile prediction techniques described above. Then, we used the predicted profiles to compute the constant miss-rate scaling factors. The right figure above shows the results. As we can see, the scaling factors are much larger for the scaled up problems compared to the smaller problems. And, almost every scaling factor is now above the bold red line. These results show that memory behavior is qualitatively different when considering scaled up problem sizes. While simulators are too slow to evaluate such large problems, multicore RD analysis can evaluate them through profile prediction.